I’ll make a little graph of the estimations of CPU usage. Sorry about the formatting, I couldn’t get an actual table to look nice:
(num of people, cpu %)
(0, 2%)
(1, 3.2%)
(2, 4.5%)
(3, 5.5%)
(4, 6.5%)
(5, 7.8%)
(6, 8.6%)
(6 with 1 Enemy, 30%)
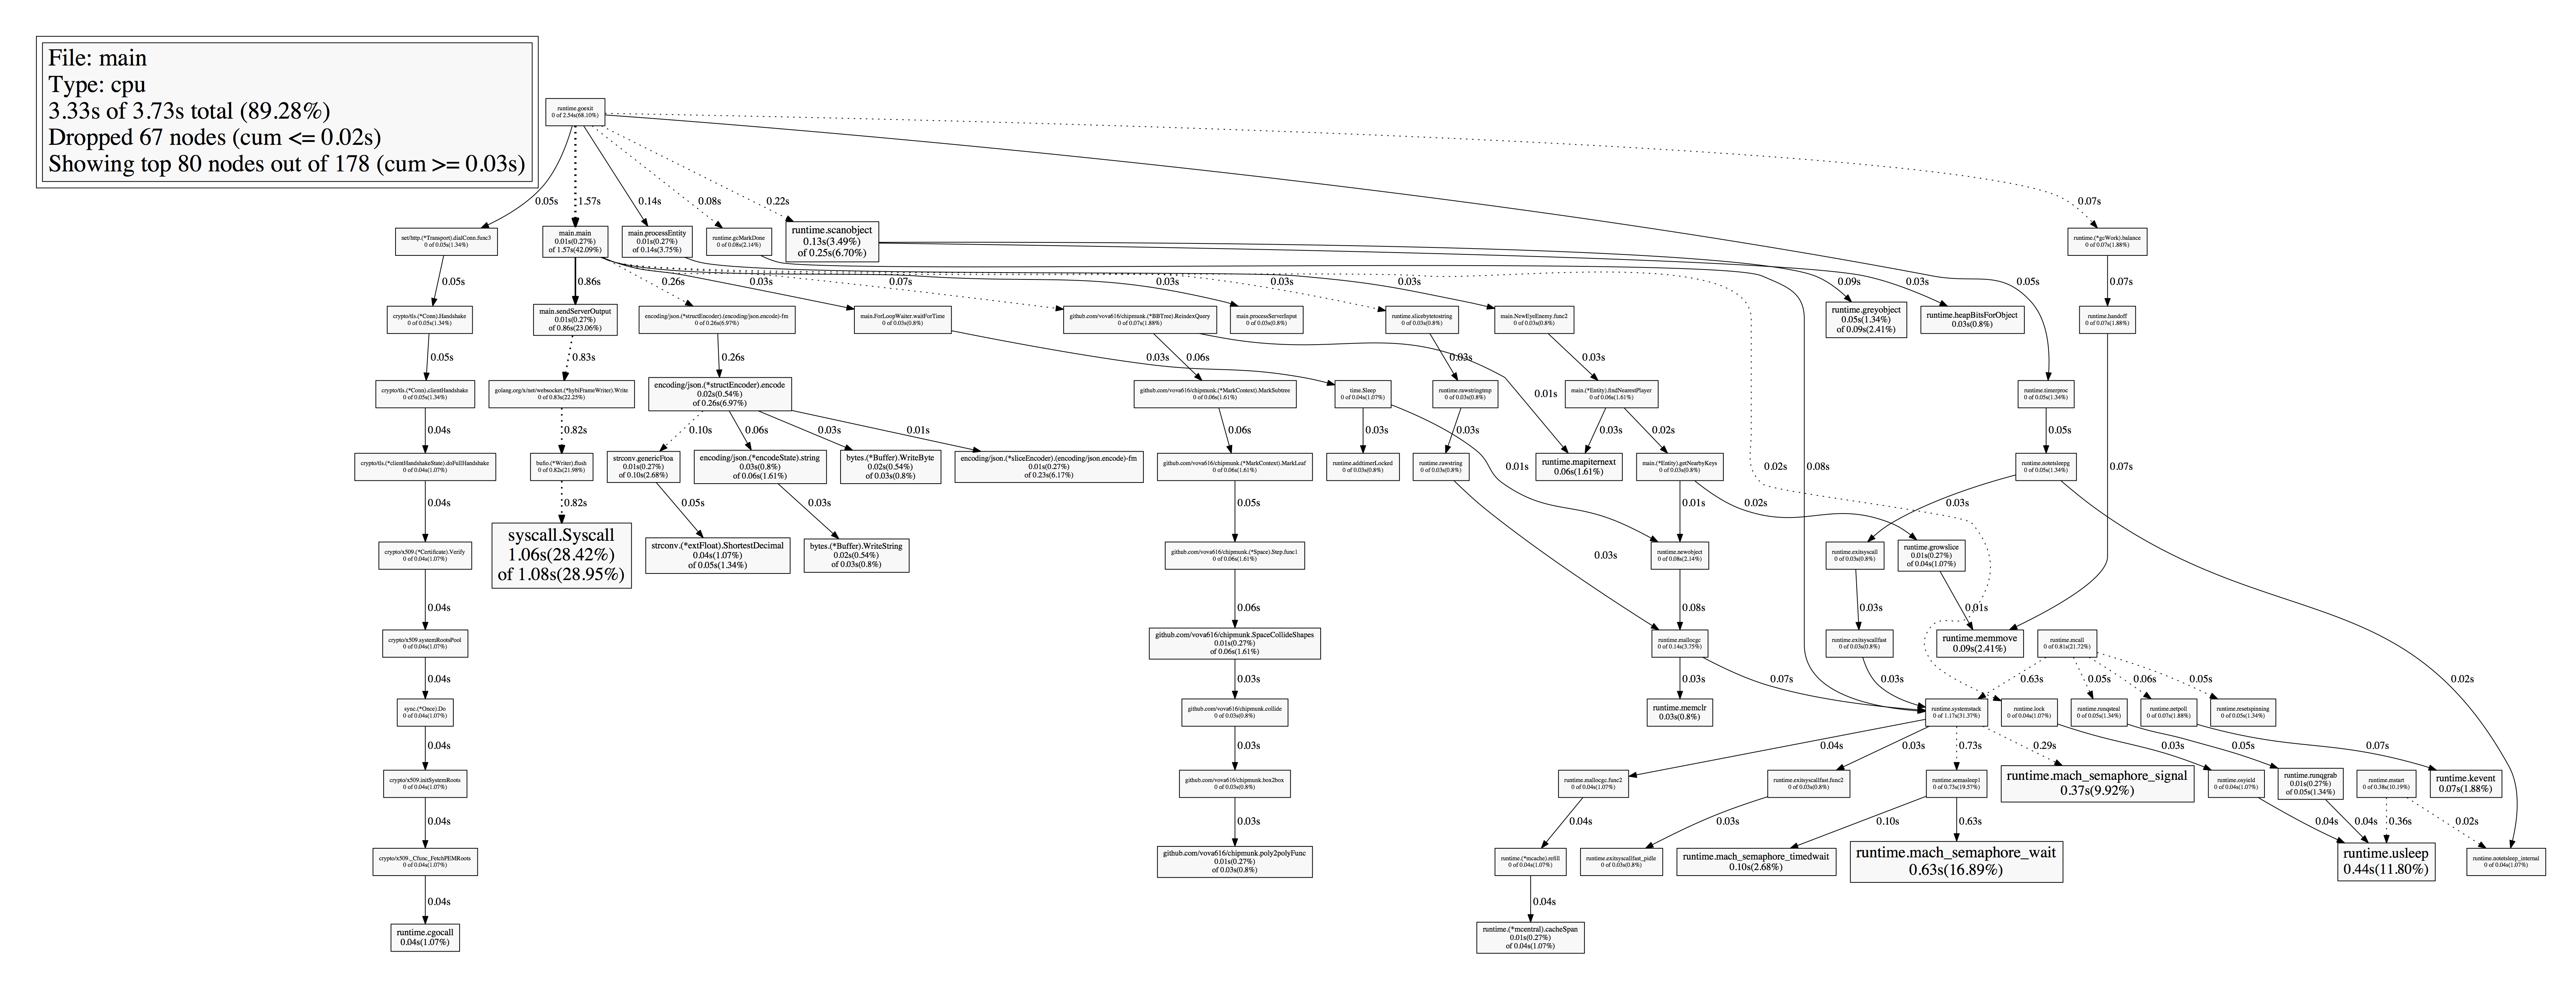
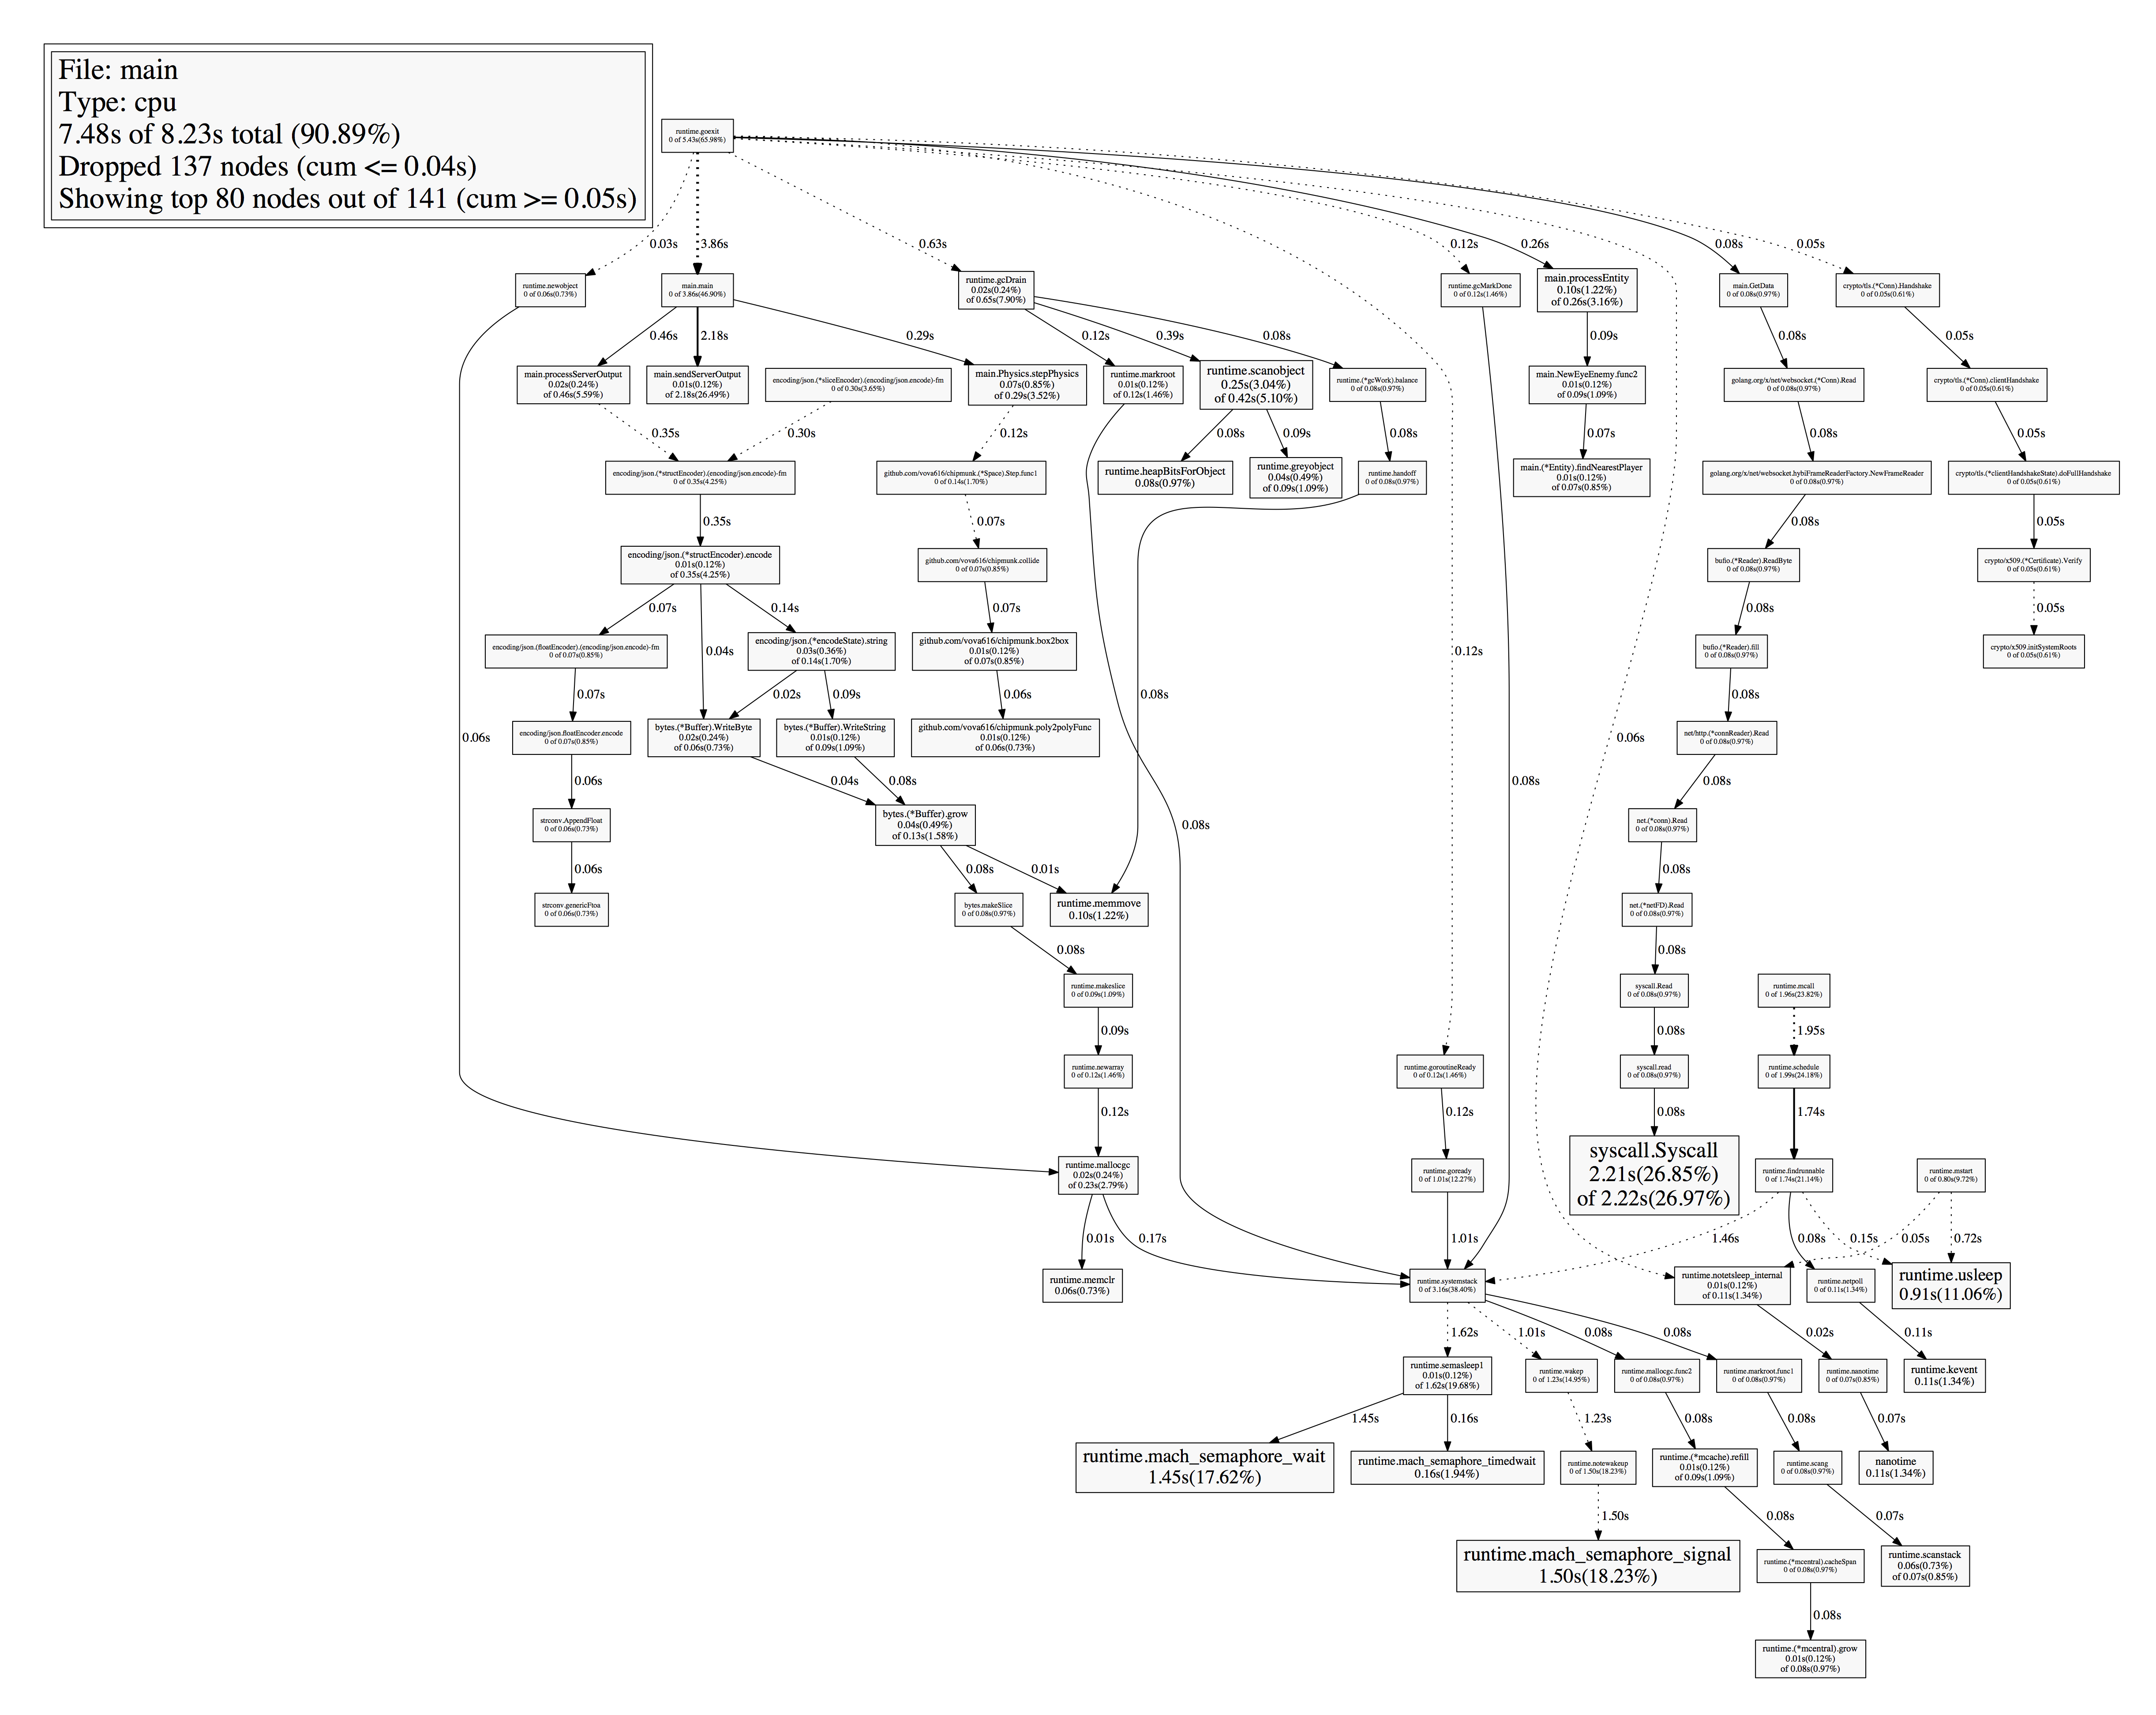
So there is definitely an issue with enemies. When I was collecting data for the profiler I did make sure I spawned an enemy and it didn’t seem like any other function was being expensive.
I tried printing the garbage collection and here’s what I got…I’m not too sure what it means though:(
gc 1 @0.007s 4%: 0.085+0.67+0.18 ms clock, 0.17+1.0/1.1/0.48+0.36 ms cpu, 4->4->1 MB, 5 MB goal, 8 P gc 2 @0.010s 6%: 0.023+1.0+0.16 ms clock, 0.070+1.1/1.5/1.3+0.48 ms cpu, 4->4->1 MB, 5 MB goal, 8 P gc 3 @0.013s 8%: 0.040+0.91+0.16 ms clock, 0.12+1.2/1.6/1.6+0.50 ms cpu, 4->4->1 MB, 5 MB goal, 8 P gc 4 @0.016s 10%: 0.054+1.6+0.22 ms clock, 0.21+1.8/2.9/3.7+0.90 ms cpu, 4->4->2 MB, 5 MB goal, 8 P gc 5 @0.019s 11%: 0.022+0.98+0.15 ms clock, 0.090+1.4/1.8/2.3+0.62 ms cpu, 4->4->2 MB, 5 MB goal, 8 P gc 6 @0.021s 12%: 0.020+0.98+0.13 ms clock, 0.080+1.2/1.9/3.0+0.55 ms cpu, 5->5->3 MB, 6 MB goal, 8 P gc 7 @0.026s 12%: 0.050+1.3+0.16 ms clock, 0.20+1.7/2.4/2.8+0.65 ms cpu, 6->6->3 MB, 7 MB goal, 8 P gc 8 @0.029s 13%: 0.14+1.6+0.17 ms clock, 0.59+1.6/2.5/3.1+0.70 ms cpu, 7->7->3 MB, 8 MB goal, 8 P gc 9 @0.033s 13%: 0.020+1.2+0.20 ms clock, 0.083+1.4/2.3/3.3+0.82 ms cpu, 6->7->5 MB, 7 MB goal, 8 P gc 10 @0.036s 14%: 0.24+1.1+0.085 ms clock, 0.98+1.2/2.0/3.3+0.34 ms cpu, 9->9->6 MB, 10 MB goal, 8 P gc 11 @0.040s 14%: 0.034+1.3+0.091 ms clock, 0.13+1.4/2.2/2.9+0.36 ms cpu, 11->11->6 MB, 12 MB goal, 8 P gc 12 @0.042s 15%: 0.13+1.4+0.27 ms clock, 0.54+1.4/2.7/3.0+1.1 ms cpu, 13->13->8 MB, 14 MB goal, 8 P gc 13 @0.045s 15%: 0.72+1.2+0.16 ms clock, 2.8+1.5/2.2/3.2+0.65 ms cpu, 16->17->12 MB, 17 MB goal, 8 P gc 14 @0.048s 16%: 0.13+2.0+0.12 ms clock, 0.55+2.0/3.5/3.7+0.50 ms cpu, 24->25->17 MB, 25 MB goal, 8 P gc 15 @0.053s 16%: 0.28+1.3+0.30 ms clock, 1.1+1.8/2.2/2.2+1.2 ms cpu, 31->32->22 MB, 34 MB goal, 8 P gc 16 @0.058s 16%: 0.19+1.6+0.14 ms clock, 0.78+1.8/2.2/2.5+0.59 ms cpu, 44->44->31 MB, 45 MB goal, 8 P gc 17 @0.070s 14%: 0.033+0.95+0.24 ms clock, 0.13+2.9/1.8/0+0.97 ms cpu, 57->57->31 MB, 62 MB goal, 8 P gc 18 @0.096s 12%: 0.096+2.3+0.10 ms clock, 0.77+6.8/3.8/0.048+0.86 ms cpu, 60->61->31 MB, 62 MB goal, 8 P
As for the client receiving data, it will just wait for data to come in from the server and update it’s game state according to the data it receives.
var sock = new WebSocket(ip); //73.158.248.23 sock.onmessage = function(m) {Server.receiveData(m, game)}
For sending data, it is constantly sending data every 15 milliseconds.
window.setInterval(function(){ game.sendData(); }, 15);
Honestly, the packets that the server sends are sometimes pretty large (I think). I’ll put an example packet below:
{"Objects":[{"Id":"887ab535-4d16-4b7a-ba5f-85089e4fbbeb","Username":"","Parent":"","Child":"","Height":0,"Type":"Npc","Tag":"EyeEnemy","Health":100,"HealthCap":100,"Power":100,"MaxPower":0,"X":743.8494262695312,"Y":748.7734375,"Rot":0.19684016704559326,"Items":null},{"Id":"ffade326-dff9-4fd5-ae26-0477e75e3e05","Username":"","Parent":"","Child":"","Height":0,"Type":"Npc","Tag":"EyeEnemy","Health":100,"HealthCap":100,"Power":100,"MaxPower":0,"X":743.4473876953125,"Y":750.5331420898438,"Rot":-0.08118445426225662,"Items":null},{"Id":"33d44406-8709-4e89-a6e1-482a3da4a320","Username":"","Parent":"","Child":"","Height":0,"Type":"Npc","Tag":"EyeEnemy","Health":100,"HealthCap":100,"Power":100,"MaxPower":0,"X":760.0582885742188,"Y":763.01904296875,"Rot":-2.2285945415496826,"Items":null},{"Id":"3f97337e-5b43-40c1-a9d8-119a842ea002","Username":"","Parent":"","Child":"","Height":0,"Type":"Npc","Tag":"EyeEnemy","Health":100,"HealthCap":100,"Power":100,"MaxPower":0,"X":756.9351196289062,"Y":768.0557250976562,"Rot":-1.9375170469284058,"Items":null},{"Id":"ae562dff-f3bb-4a54-8aa5-49fb5e466d33","Username":"","Parent":"","Child":"","Height":0,"Type":"Npc","Tag":"EyeEnemy","Health":100,"HealthCap":100,"Power":100,"MaxPower":0,"X":755.141357421875,"Y":778.2151489257812,"Rot":-1.7510385513305664,"Items":null},{"Id":"1ecc1629-7369-4406-89f2-0aca9ad3886a","Username":"","Parent":"","Child":"","Height":0,"Type":"Npc","Tag":"EyeBoss","Health":500,"HealthCap":500,"Power":100,"MaxPower":0,"X":750,"Y":750,"Rot":0,"Items":null},{"Id":"f178503a-05b7-4e38-98da-9a0e5ad777aa","Username":"","Parent":"","Child":"","Height":0,"Type":"Npc","Tag":"EyeEnemy","Health":100,"HealthCap":100,"Power":100,"MaxPower":0,"X":767.244140625,"Y":775.5899047851562,"Rot":-2.1637659072875977,"Items":null},{"Id":"916b895d-0b42-4fa8-ad05-cc4d98370c2a","Username":"","Parent":"","Child":"","Height":0,"Type":"Npc","Tag":"DickEnemy","Health":500,"HealthCap":500,"Power":100,"MaxPower":0,"X":-700,"Y":-700,"Rot":0,"Items":null},{"Id":"d1220ac7-ea44-4d2b-9954-003574af0642","Username":"","Parent":"","Child":"","Height":0,"Type":"GameObject","Tag":"Laser MKII","Health":100,"HealthCap":100,"Power":100,"MaxPower":0,"X":-50,"Y":-50,"Rot":0,"Items":null}],"Cp":{"Id":"7629ab7d-8cab-4c96-ad4a-5d1116f8fc46","Username":"Johnsy","Parent":"","Child":"","Height":0,"Score":0,"Health":100,"HealthCap":100,"Power":200,"MaxPower":200,"X":0,"Y":0,"Rot":-0.05031720548868179,"MouseAngle":0,"Items":["","","","","","",""],"Targets":[{"Distance":70,"Angle":-2.356194490192345}]},"Leaderboard":[{"Username":"Johnsy","Score":0},{"Username":"","Score":0},{"Username":"","Score":0},{"Username":"","Score":0},{"Username":"","Score":0}]}
It’s around 2500 bytes. It seems large to me but maybe I’m just underestimating what I’m able to send over sockets?

 Do you think it would make that much of a difference in the server’s performance to switch to TCP/UDP? Because as it is the messages are being sent fast enough and there isn’t much lag it’s just that the server is being very expensive.