Dear community,
could you please help me to figure out why my go application consumes but doesn’t free memory?
Context:
I have Go web app, which under the hood executes shell scripts like this:
func buildRelease(path string) error {
	cmd := exec.Command(ReleaseBuilderCmd, "-p", path)
	stdout, err := cmd.CombinedOutput()
	if err != nil {
		output := string(stdout[:])
		zap.S().Infof("%s", output)
		return errCreate
	}
	return nil
}
ReleaseBuilderCmd shell script generates files metadata and writes to the disk.
Problem:
If I perform some request with this func against large amount of data (~100Gb) I see that up to 1.5Gb of memory is being used and not freed up after the func is done (my application was deployed into the K8S):
Every 2.0s: kubectl top pod repolite-5f9f6bb846-tqwdq --containers                                                                             local: Sat Apr  2 13:05:39 2022

POD                         NAME          CPU(cores)   MEMORY(bytes)
repolite-5f9f6bb846-tqwdq   repolite      1m           1593Mi
It takes up to 14 hours to free up the memory, if no new requests were performed.
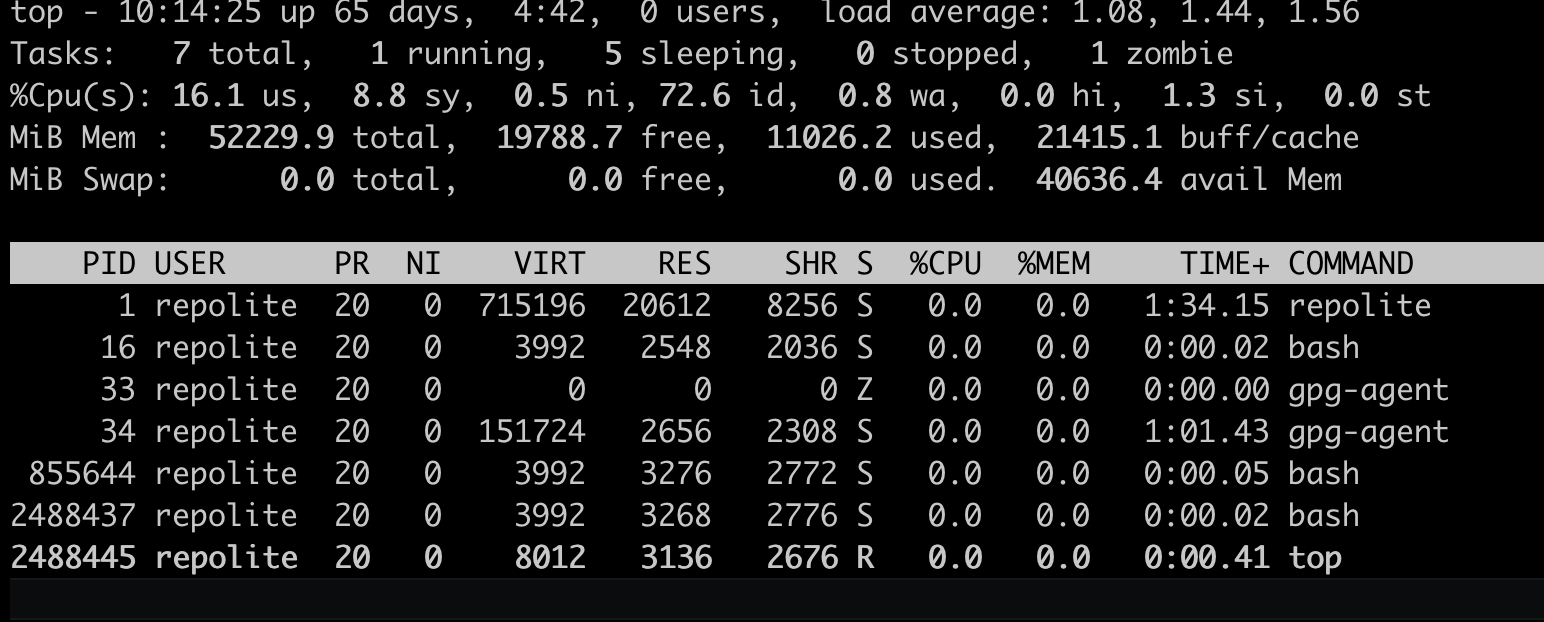
The top picture inside the container is like the following:
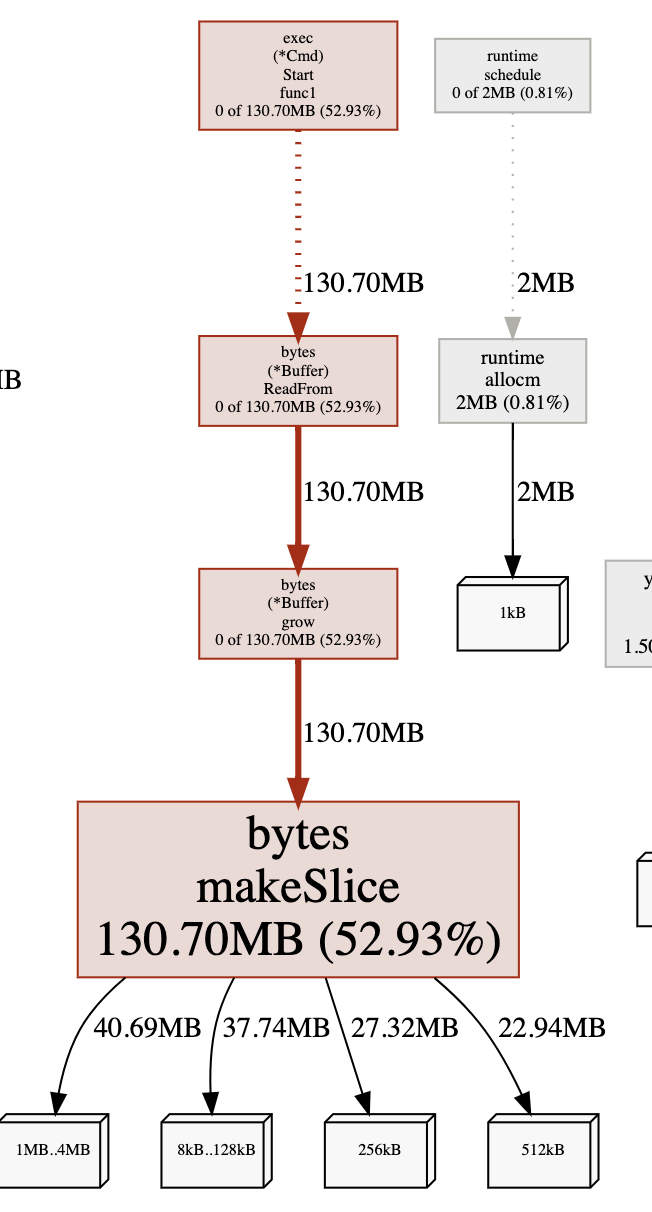
I’ve run the pprof to check heap allocations:
 ~ go tool pprof http://<REDACTED>/debug/pprof/heap
...
/pprof.repolite.alloc_objects.alloc_space.inuse_objects.inuse_space.049.pb.gz
File: repolite
Type: inuse_space
Entering interactive mode (type "help" for commands, "o" for options)
(pprof) top
Showing nodes accounting for 6630.87kB, 100% of 6630.87kB total
Showing top 10 nodes out of 66
      flat  flat%   sum%        ■■■   ■■■%
    2050kB 30.92% 30.92%     2050kB 30.92%  runtime.allocm
  902.59kB 13.61% 44.53%  1414.74kB 21.34%  compress/flate.NewWriter
  583.01kB  8.79% 53.32%   583.01kB  8.79%  reflect.mapassign
  528.17kB  7.97% 61.29%   528.17kB  7.97%  regexp.(*bitState).reset
  518.65kB  7.82% 69.11%   518.65kB  7.82%  google.golang.org/protobuf/internal/strs.(*Builder).AppendFullName
  512.20kB  7.72% 76.83%   512.20kB  7.72%  runtime.malg
  512.16kB  7.72% 84.56%   512.16kB  7.72%  compress/flate.newHuffmanBitWriter (inline)
  512.05kB  7.72% 92.28%   512.05kB  7.72%  runtime.acquireSudog
  512.05kB  7.72%   100%  1613.71kB 24.34%  runtime.main
         0     0%   100%  1414.74kB 21.34%  bufio.(*Writer).Flush
I can’t find here the hundred of megabytes of consumed memory… It’s weird.
I thought that it could a linux buffers and added additional handler to force a cleanup:
func freeHandler() http.Handler {
	return http.HandlerFunc(func(w http.ResponseWriter, r *http.Request) {

		debug.FreeOSMemory()
		w.WriteHeader(http.StatusOK)
		w.Header().Set("Content-Type", "application/text")
		w.Write([]byte("OK"))

	})
}
But even that didn’t help me to free-up the memory, I do understand that it is a hack, and it’s better to give a chance to GC to free its own memory, but still can’t understand - which entity consumes >1.5Gb of memory?
Appreciate your time while reading this and any suggestion.
Thank you,
P.