tldr; When running grpc server and clients, why is the server-side gorountine queuing delay (/sched/latencies:seconds) from package *runtime metrics much slower than the real latency measured at client-side?
Description:
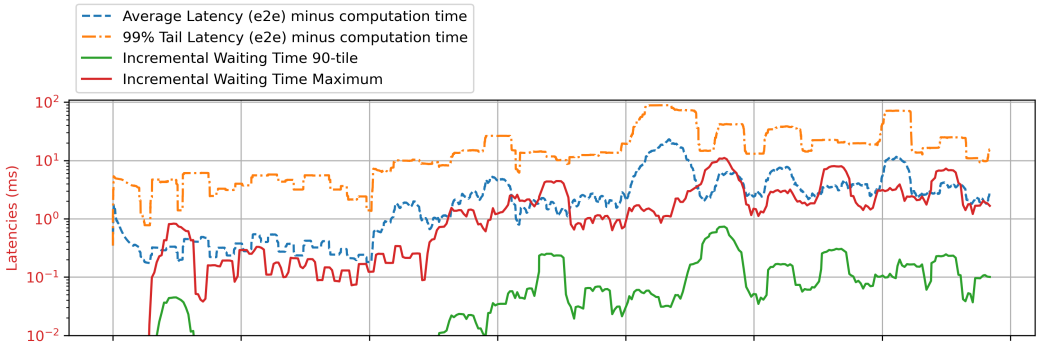
When running microservices under heavy load, the average or maximum queuing delay is commonly used as a signal of congestion (Dagor 2018, Breakwater 2020). I have been attempting to collect this information for overload control on a go-grpc server. Since goroutines are scheduled by Go runtimes, I tried to use the waiting time information for goroutines. However, the /sched/latencies:seconds metric from /runtime/metrics seems to be significantly delayed. I calculate the 90th percentile and max latency as the green, red solid line in the figure, but it always reports latency peaks 0.5 seconds later after the peaks happened (the dotted line, e2e latency measured from client side).
The plots shows one instances of GreetingServiceServer, with 10ms computation involved (but deducted in figure). The /sched/latencies:seconds are sampled at 20ms interval. I increased the load after the 4th second, where you can see a peak of e2e latency there.
My question is:
Where does the delay occur in the case of an overloaded unary gRPC server? Is /sched/latencies:seconds a correct measure for this queuing delay?
As shown in the figure above, there’s is a huge gap horizontally (/sched/latencies:seconds is 0.5 second later than e2e measures), why is it the case?
Any way to fix it? Any other measurement available for golang to track the queuing delay?
Hi @christophberger, thanks for your help!
I do have the time stamps on x axis, it was cropped off since the plot was actually a subplot. Please see this one as an example for the 0.5 delay.
I align them by the absolute time on my machine (both client and server are on my laptop), on client side it timestamp each rpc request when sending them. On server side I sample /sched/latencies per time interval (20ms for example) and substract to get the max latency (green line in this plot) with
// Find the maximum bucket between two Float64Histogram distributions
func maximumQueuingDelayms(earlier, later *metrics.Float64Histogram) float64 {
	for i := len(earlier.Counts) - 1; i >= 0; i-- {
		if later.Counts[i] > earlier.Counts[i] {
			return later.Buckets[i] * 1000
		}
	}
	return 0
}
You are right, there’s no wall-clock timestamps for the /sched/latencies:seconds, which is confusing by itself…
I dug a bit into Go’s runtime code and found the following.
/sched/latencies:seconds reads data from sched.timeToRun: (file runtime/metrics.go)
		"/sched/latencies:seconds": {
			compute: func(_ *statAggregate, out *metricValue) {
				hist := out.float64HistOrInit(timeHistBuckets)
				hist.counts[0] = sched.timeToRun.underflow.Load()
				for i := range sched.timeToRun.counts {
					hist.counts[i+1] = sched.timeToRun.counts[i].Load()
				}
				hist.counts[len(hist.counts)-1] = sched.timeToRun.overflow.Load()
			},
timeToRun is of type timeHistogram, which has a method record() that records one duration into the histogram (file runtime/histogram.go):
func (h *timeHistogram) record(duration int64) {

	// omitted: calculate bucket and subBucket from duration...

	h.counts[bucket*timeHistNumSubBuckets+subBucket].Add(1)
}
In runtime/proc.go, function casgstatus() calls record() to report the waiting time every time a goroutine switches from waiting to running state:
	case _Grunning:
		// We're transitioning into running, so turn off
		// tracking and record how much time we spent in
		// runnable.
		gp.tracking = false
		sched.timeToRun.record(gp.runnableTime)
		gp.runnableTime = 0
	}
So the histogram is updated in real time, and this is why it records no time stamps.
Long story short: goroutine scheduling latencies are recorded without delay, at the moment a goroutine transitions into running. They do not seem to cause the delay seen in the graph.
I suppose that the observed goroutine latency does not directly correlate with the queueing delay of the gRPC calls. I could imagine that those goroutines that spend lots of time in runnable state aren’t those who actually serve the gRPC requests. Rather, these goroutines start later, while the app is still busy with a lot of running goroutines from the previosu request. And this delays the start of new goroutines and keeps them in runnable status for some time.
The “/sched/latencies:seconds” metric in Go provides information about goroutine queuing delays. It measures the time duration between when a goroutine is ready to run and when it actually starts executing on a processor. A large value for this metric indicates that there is a significant delay in scheduling goroutines for execution.
There can be several reasons why the “/sched/latencies:seconds” metric shows a largely delayed value for goroutine queuing delay:
High CPU utilization: If the system is under heavy load or the CPU is highly utilized, there may be a delay in scheduling goroutines due to competition for CPU resources. The operating system scheduler needs to allocate CPU time to different processes and threads, and if the system is overwhelmed, it can cause delays in goroutine execution.
Concurrent execution bottlenecks: If your application has a large number of goroutines contending for shared resources or synchronization primitives (such as locks or channels), it can lead to queuing delays. Contentions and bottlenecks can arise from inefficient locking strategies, excessive context switching, or improper resource management.
Blocking operations: If goroutines frequently perform blocking operations, such as waiting for I/O or network operations, it can contribute to queuing delays. When a goroutine is blocked, the scheduler needs to switch to another runnable goroutine, and upon completion of the blocking operation, it needs to reschedule the previously blocked goroutine, which adds to the delay.
External factors: Delayed goroutine scheduling can also be influenced by external factors such as the underlying operating system’s scheduling policies, hardware limitations, or interference from other processes or threads running on the same system.
To address and mitigate delayed goroutine queuing delays, consider the following steps:
Analyze your code and identify any performance bottlenecks, excessive resource contention, or blocking operations. Optimize your code to minimize contention and improve resource management.
Review your goroutine design and concurrency patterns. Ensure that goroutines are used efficiently, and avoid unnecessary blocking operations.
Consider adjusting the number of goroutines or utilizing a pool of workers to limit the concurrency level and prevent excessive queuing delays.
Monitor and profile your application using Go’s built-in profiling tools (e.g., go tool pprof). This can help identify specific areas of your code that contribute to queuing delays and guide optimization efforts.
Consider using other concurrency primitives, such as channels, to coordinate and synchronize goroutines effectively.
Hi @christophberger I really appreciate your efforts and analysis! I agree with you that the metrics of latencies are instantly recorded. However, I feel that the latency from /sched/latencies:seconds are correlated with the end2end latency.
The reasons are:
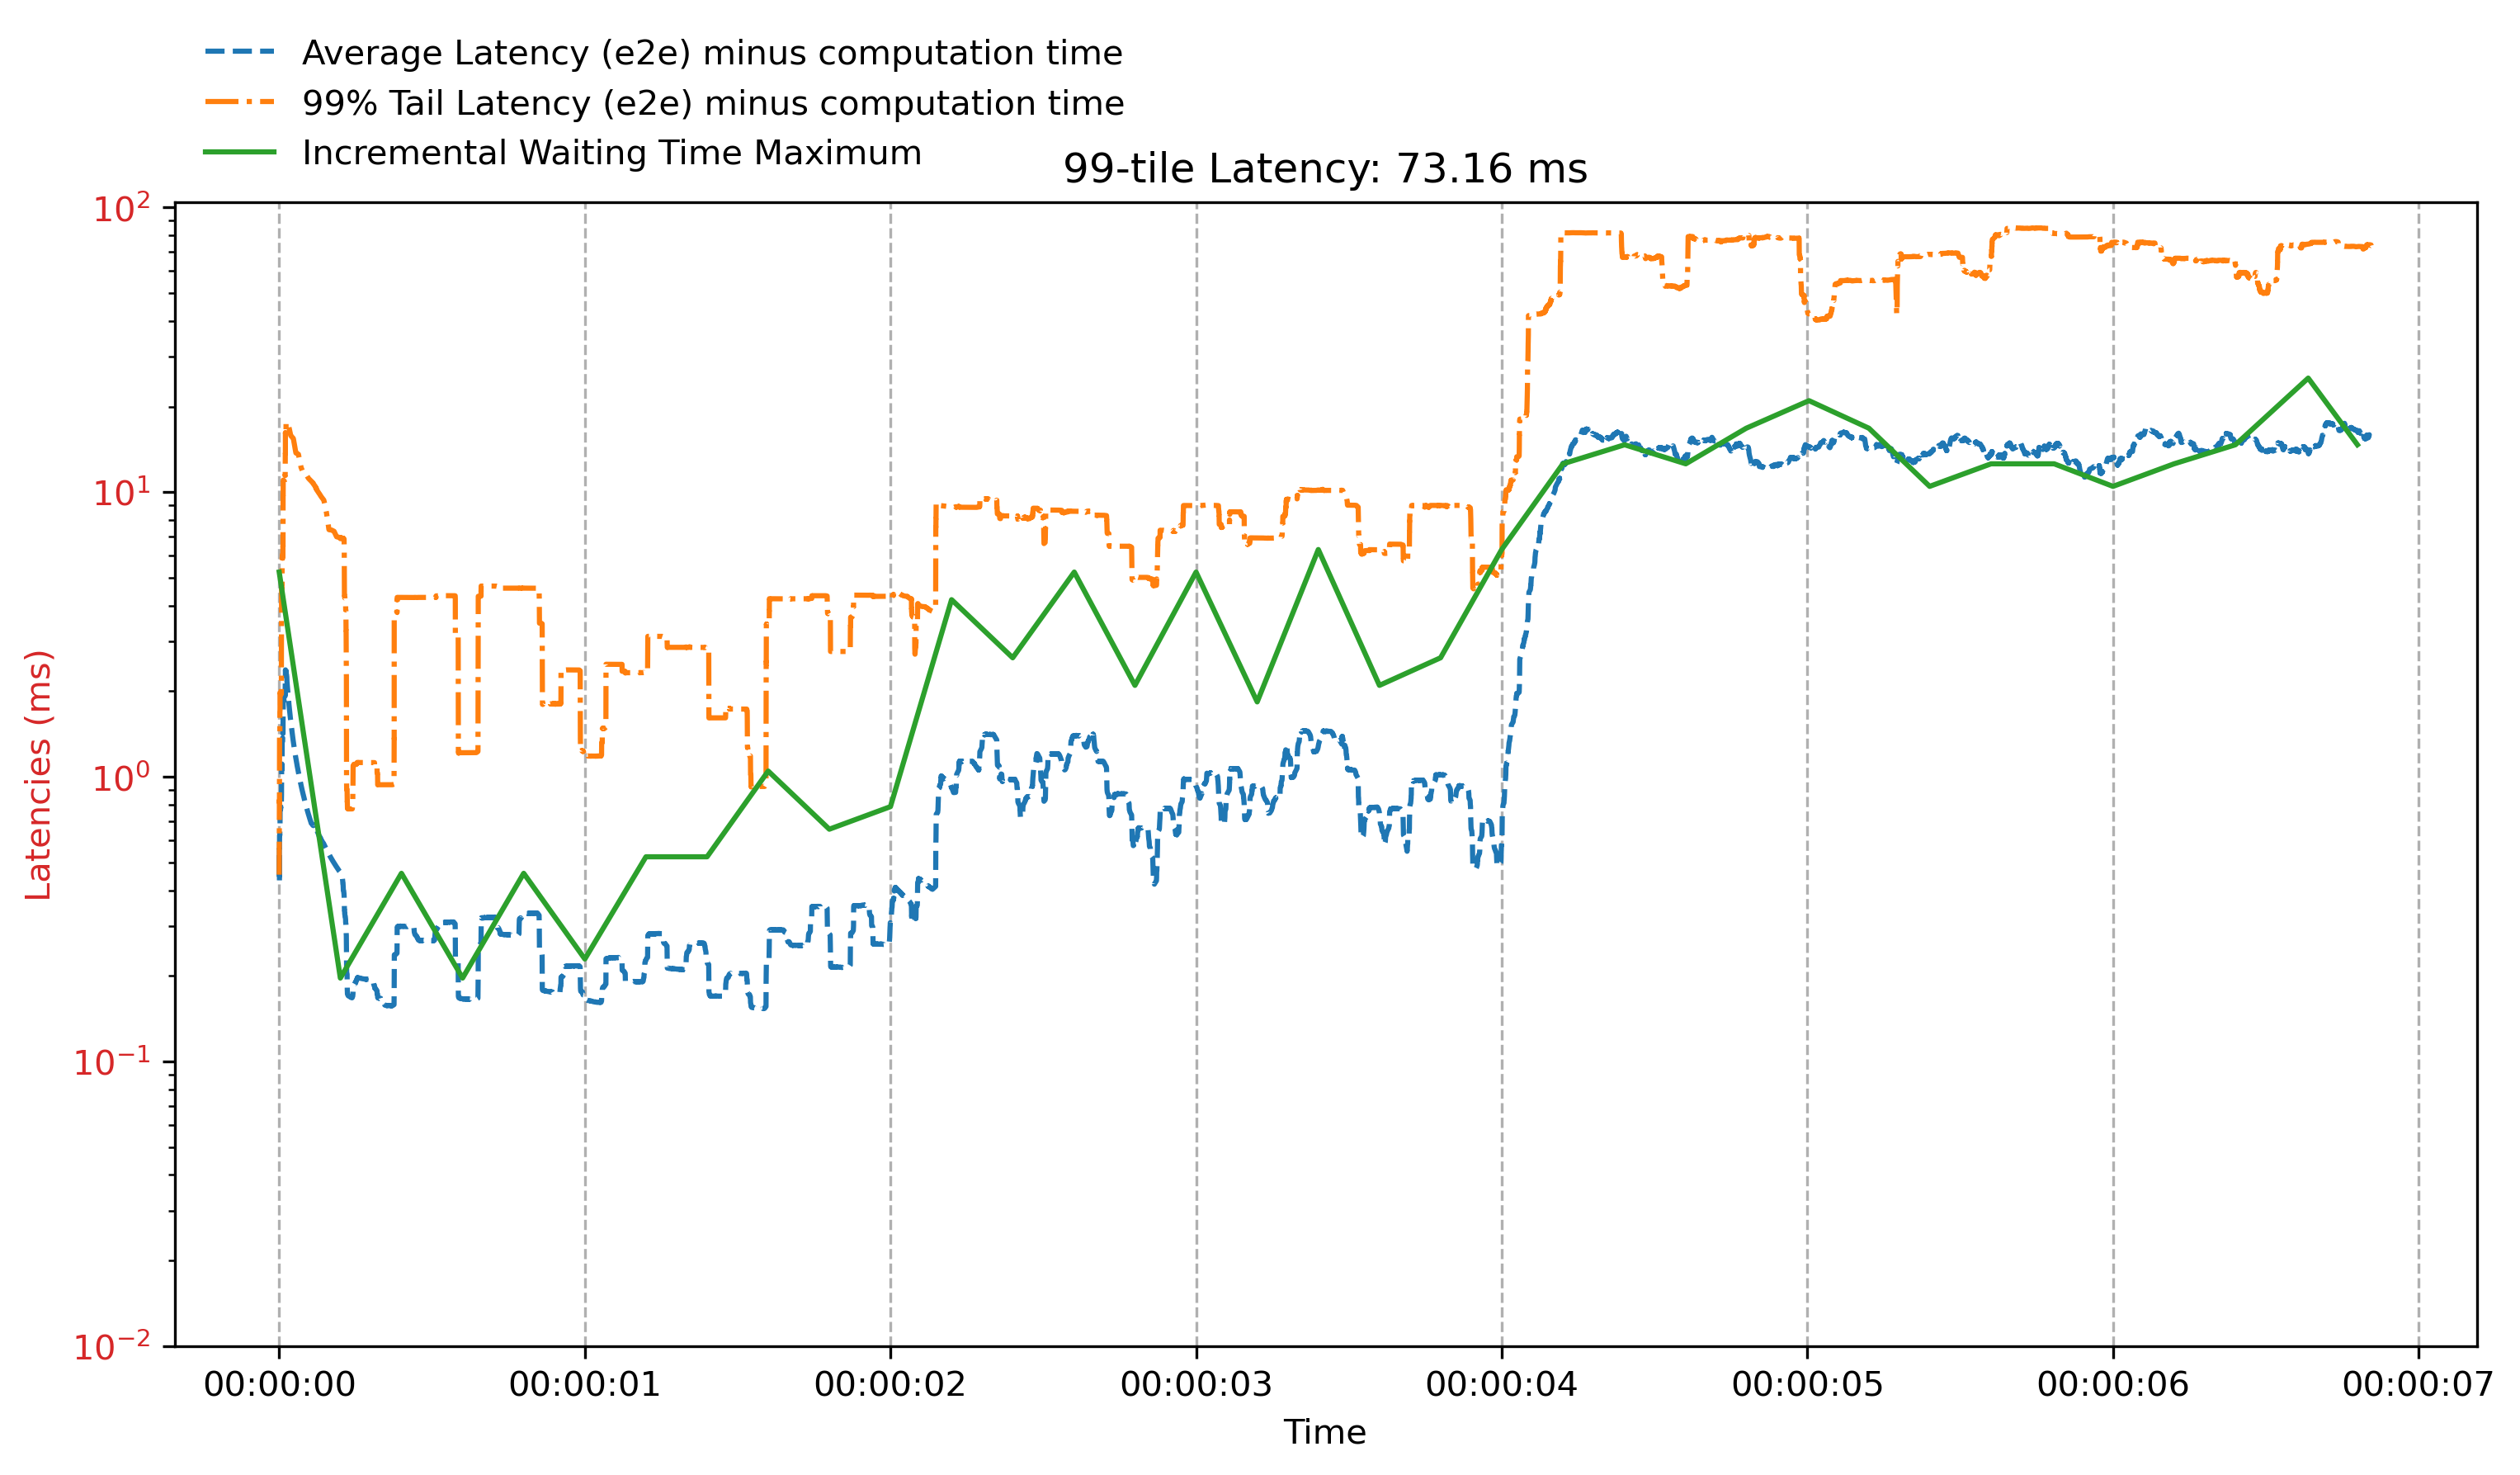
The time-series of both trends are highly overlapping. I found that the vertical gap can disappear if I sample the /sched/latencies:seconds at lower rates. The plot below has the same setup of overload with the 20ms figure above, but with 200ms interval (of reading /sched/latencies:seconds)
We see that in the second plot when /sched/latencies:seconds is queried every 200ms (the query is timed and done with a separate goroutine from the app running), it actually perfectly match the trend of e2e latency… This weird observation is reproducible on my machine. It indicates that the frequency of querying /sched/latencies:seconds impacts the content of /sched/latencies:seconds. But it is up-to-date sometimes.
If, after a certain point, the requests start experiencing significantly higher end-to-end latency (e.g., at the beginning of the 2nd and 4th second), it is likely that these requests were spending a longer time waiting to be processed. Therefore, I believe that the requests with very high end-to-end latency (orange line) are the same requests being processed by some long-waiting goroutines (green line). If the latency is not due to the goroutine waiting time, I wonder where else it could occur for a request with high end-to-end latency, given the constant computation time and small network delay…
Therefore, I feel like that And this delays the start of new goroutines and keeps them in runnable status for some time. is the direct reason of rather than the consequence of a high e2e latency (orange line). Does this reasoning make sense?
sampling the goroutine latencies every 20ms causes a delay of half a second,
but sampling them every 200ms makes the graphs match perfectly?
Can it be that the graph just appears to be matching because the low sample rate removes the details?
Just a quick thought: What if the e2e latency is caused by goroutines that are blocked (due to I/O)? The blocking time would not be collected in the /sched/latencies:seconds metric. Only after the blocked goroutine switches into the Runnable state, the respective latency gets measured.
This still does not explain why this should always happen half a second later…