We are facing a memory leak in golang rest api + ecs which can be fixed only after restart.
Problem :
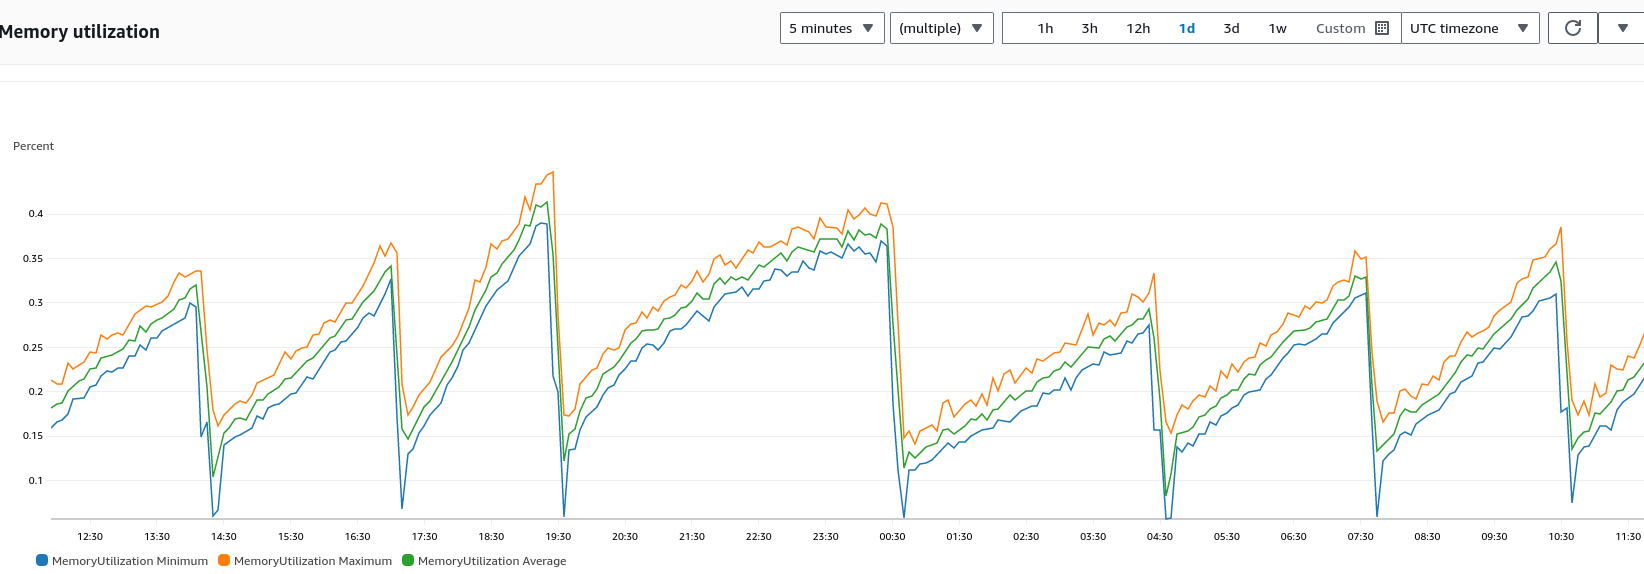
memory does not go above 0.7. At 0.7 memory Go App stops responding and we have to restart it.
We first time tried pprorf and tried alloc space. because this is rest api, we are returning encrypted json. We have doubt on encyption method used for this problem and want help if we are in the right direction.
Suspected Code and what we tried
    dashboard := make(map[string]interface{})
dashboard["feature_banner"] = l_feature_data
dashboard["home_category"] = home_category_data
res["dashboard"] = dashboard

mres, _ := json.Marshal(res)
ress := ""
ress = util.EncryptDatas(string(mres))
c.JSON(200, gin.H{"code": 1, "result": ress})
func EncryptDatas(data string) string {
bKey := byte(key)
bIV := byte(iv)
bPlaintext := PKCS5PaddingNew(byte(data), aes.BlockSize, len(data))
block, err := aes.NewCipher(bKey)
if err != nil {
}
ciphertext := make(byte, len(bPlaintext))
mode := cipher.NewCBCEncrypter(block, bIV)
mode.CryptBlocks(ciphertext, bPlaintext)
return hex.EncodeToString(ciphertext)
}
    Alloc Space -> EncryptDatas + String(res) : 2493.72MB, 93.06% of 2679.79MB - https://ibb.co/wdrKD0T
    Alloc Space -> Without EncryptDatas + String(res) both : 1256.06MB, 87.43% of 1436.63MB : https://ibb.co/t3yTR05
    Alloc Space -> only String(res) : 1692.63MB, 91.61% of 1847.71MB total : https://ibb.co/7N84yMS

We are seeking help on following :

    Are we on right track to find the problem ? Never did pprof before.
    Encryption is causing the problem ? hex.EncodeToString can be the issue
    can we manually clean the heap/memory in golang for stopping it to 0.7

Also this is not a problem with particular api.