Hi there
I am maintaing the code for a Go project that reads and writes a lot of data and that has done so successfully for some time. Recently, I made a change: a CSV file with about 2 million records is loaded in a map with struct values at the beginning of the program. This map is only used in part B, but first part A is executed. And this first part already runs noticeably slower than before (processing time is quadrupled). That is very strange since that part of the logic did not change.
I have spent a week trying to explain how this can happen. Here are the steps I have taken (when I mention performance, I always refer to part A, which does not include the time to load the data in memory and actually has nothing to do with it):
- The program was running on a server inside a Docker container. But I have been able to reproduce it on my laptop without container: the performance indeed decreases compared to when I run it without the data from the file loaded in memory.
- The server had a huge amount of RAM. Although obviously more memory is used when the file is loaded, no limits are hit. I also did not see spikes or other strange patterns in memory usage and disk I/O. For these checks, I have used pprof, htop and iotop.
- When the data is loaded but then the map set to nil, performance is OK again.
- Loading the data in a slice instead of a map reduces the performance decrease from x4 to x2 (but the memory usage is more or less the same as with the map).
- This made me wonder whether the map/slice is accessed somewhere in part A, even though it shouldn’t. The map is stored as field of a struct type. I checked and this struct is always passed by pointer (including all goroutines). Making it a global variable instead of a pointer field did not solve the issue.
- There is one dependency outside of the standard library. Is the problem caused by the library? It forces some garbage collects. Disabling this does not make a difference. I found another similar library that is unrelated and using this one as a replacement improves performance, but it still takes longer when the data of the file is loaded.
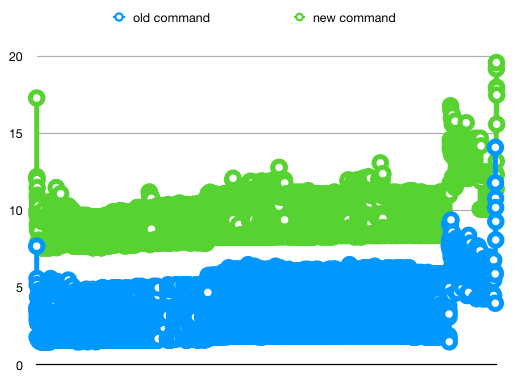
Here I have plotted the metrics (time spent per batch of operations in part A) with and without the data in memory:
This issue is really puzzling me. Can your code run significantly slower just because more memory is occupied, even when there is a lot of memory available? If not, what can I do to find the cause of the issue?