Help me understand the profiler?

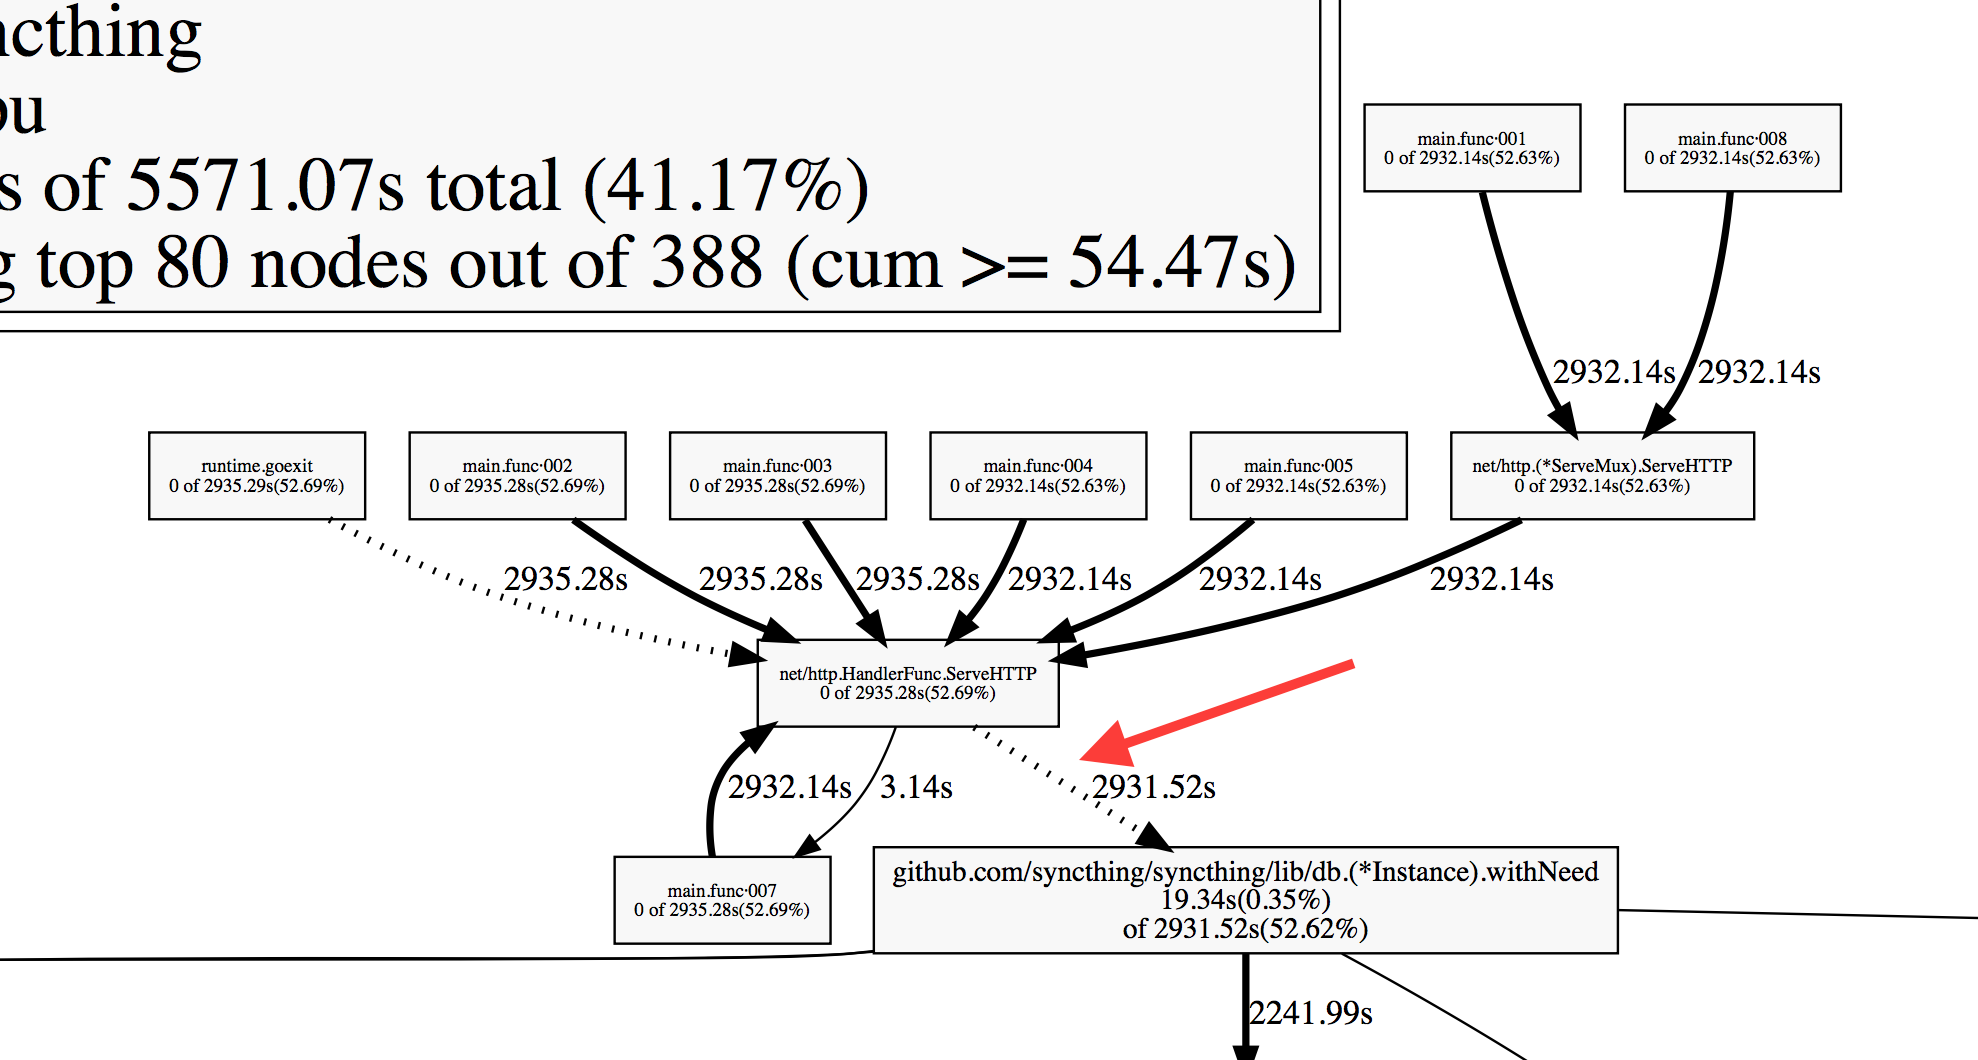
I’m trying to understand a profile showing a lot of CPU usage underneath ServeHTTP, where HTTP serving is supposed to be a small part of the overall program’s profile. I can see that a few expensive database calls are being made, but these can be called from several handlers and I’m not able to figure out which handlers are responsible. Using the “web” command, I get this:

where the part of the call stack I’m actually interested in is somewhere in the dotted line I’ve pointed to - I know withNeed() is expensive, but I need to know which request handler called it. I’ve tried playing around with focus=..., edgefraction=0, nodefraction=0 and various web calls that should focus on the stuff that should be in there, but it doesn’t affect this part of the graph.

The actual code for this part is here - all the handlers are method values, does that make them unprofileable here or something? Perhaps they are the loose main.func·007 and so on referred to above?


Edit: If anyone’s interested in taking a look for themselves, the profile and accompanying binary is here.

Not sure if I should be impressed that I apparently understand the profiler as well as anyone, or sad that apparently nobody really understands the profiler… :wink:

1 Like

I think you need to keep following the trace down further, those functions don’t account for much time by themselves. Looking at the profile, most of the time is being spent in leveldb.

1 Like

So (part of) the problem is that there are a lot of closures on the way to the actual HTTP handler, adding things like authentication, debugging, CSRF checks and so on. These are the main.func·003 etc in the list above. The solution turned out to be not to use the web view (awesome as it is), but do what @dfc suggests. Using lines (to see what the closures represented) and sorting by ■■■ makes it easy to track down the first “interesting” hit:

(pprof) ■■■
(pprof) lines
(pprof) top20
4.08s of 5571.07s total (0.073%)
Dropped 4452 nodes (cum <= 27.86s)
Showing top 20 nodes out of 211 (cum >= 2242.81s)
      flat  flat%   sum%        ■■■   ■■■%
         0     0%     0%   4388.03s 78.76%  runtime.goexit /usr/local/go1.4.3/src/runtime/asm_amd64.s:2232
         0     0%     0%   2935.28s 52.69%  main.func·002 [...]syncthing/cmd/syncthing/gui.go:300
         0     0%     0%   2935.28s 52.69%  main.func·003 [...]syncthing/cmd/syncthing/gui.go:333
         0     0%     0%   2935.28s 52.69%  net/http.(*conn).serve /usr/local/go1.4.3/src/net/http/server.go:1204
         0     0%     0%   2935.28s 52.69%  net/http.HandlerFunc.ServeHTTP /usr/local/go1.4.3/src/net/http/server.go:1265
         0     0%     0%   2935.28s 52.69%  net/http.serverHandler.ServeHTTP /usr/local/go1.4.3/src/net/http/server.go:1703
         0     0%     0%   2932.14s 52.63%  main.func·001 [...]syncthing/cmd/syncthing/gui.go:288
         0     0%     0%   2932.14s 52.63%  main.func·004 [...]syncthing/cmd/syncthing/gui.go:343
         0     0%     0%   2932.14s 52.63%  main.func·005 [...]syncthing/cmd/syncthing/gui.go:351
         0     0%     0%   2932.14s 52.63%  main.func·008 [...]syncthing/cmd/syncthing/gui_csrf.go:51
         0     0%     0%   2932.14s 52.63%  net/http.(*ServeMux).ServeHTTP /usr/local/go1.4.3/src/net/http/server.go:1541
         0     0%     0%   2931.53s 52.62%  main.func·007 [...]syncthing/cmd/syncthing/gui_auth.go:93
         0     0%     0%   2931.52s 52.62%  github.com/syncthing/syncthing/lib/db.(*FileSet).WithNeedTruncated [...]syncthing/lib/db/set.go:169
         0     0%     0%   2897.53s 52.01%  github.com/syncthing/syncthing/lib/model.(*Model).Completion [...]syncthing/lib/model/model.go:347
         0     0%     0%   2897.53s 52.01%  main.(*apiSvc).getDBCompletion [...]syncthing/cmd/syncthing/gui.go:433
                                                           ^^^ There! That's my HTTP handler. :)

         0     0%     0%   2897.53s 52.01%  main.*apiSvc.(main.getDBCompletion)·fm [...]syncthing/cmd/syncthing/gui.go:137
     1.48s 0.027% 0.027%   2578.79s 46.29%  github.com/syndtr/goleveldb/leveldb.(*Snapshot).Get [...]syncthing/Godeps/_workspace/src/github.com/syndtr/goleveldb/leveldb/db_snapshot.go:113
...
1 Like

This topic was automatically closed 90 days after the last reply. New replies are no longer allowed.