I kind of feel like I’m taking crazy pills and missing something extremely obvious here. I’ve reported a Delve bug before only for it to end up getting rerouted as a Go bug instead, and this time I want to check if anyone else has seen this or knows of it as a known issue (or user error of course, which is the most likely scenario).
I have a more detailed version below, but the tl;dr is:
I am seeing variables being reported as nil, as default-value structs, and as empty strings in the debugger. A variable will look right on one line and turn empty or nil the next. Has anybody seen this?
This is Go 1.11 rc1, GoLand 2018.2.1 and…whatever version of Delve 2018.2.1 ships with.
I’ve done a bit of searching through Delve issues and have run across some issues with local variables missing, but it seemed specific to VS Code and I am not sure it’s relevant here. Maybe I missed an existing issue for this already though?
The situation is: I am starting a test on my client, which spins up a new server. I am then attaching to the server process and stepping through the server-side breakpoints. I am running go build and go install between runs so the server binary I’m running should ™ be in sync with the source I’m stepping through.
Edit: I should note that I have also tried building without compiler optimization and inlining via -gcflags '-N -l' - maybe I missed some other flags needed here? I have also checked that there are no multiple versions of my server on the system (so the client shouldn’t be using some old outdated server binary)
Here is the longer version with code and screenshots to hopefully help another set of eyes spot any problems between keyboard and chair:
I am retrieving a custom request struct from a *http.Request. This works fine. The struct is defined as follows:
type JarReq struct {
	request
	Jar          domain.Jar `json:"jar"`
	AuthProvider string     `json:"authProvider"`
}
So in function A I’m running jarReq, err := getJarReq(r), which does this:
func getJarReq(r *http.Request) (restapi.JarReq, error) {
	var jar restapi.JarReq
	body, err := ioutil.ReadAll(io.LimitReader(r.Body, 1048576))
	if err != nil {
		return jar, err
	}

	defer r.Body.Close()

	if err := json.Unmarshal(body, &jar); err != nil {
		return jar, err
	}
	return jar, nil
}
Then in function A I call this error handling function:
func HandleReqErr(err error, w http.ResponseWriter) {
	if err == nil {
		return
	}
	util.HandleErr(err, "CreateUserErr")
	w.Header().Set("Content-Type", "application/json; charset=UTF-8")
	w.WriteHeader(422) // unprocessable entity
	if err := json.NewEncoder(w).Encode(err); err != nil {
		util.HandleErr(err, "CreateUserErr")
	}
}
All it does is return because err is nil.
I then pass jarReq to another function: jarRes, err := createJar(jarReq)
Which is defined as follows:
func createJar(jarReq restapi.JarReq) (jarRes restapi.ExportedJarRes, err error) {
	jar := jarReq.Jar
	repo, err := domain.NewJarRepo(env.App.Database)
	eRes := restapi.ExportedJarRes{}
	res, err := handlers.CreateModel(repo, &jar, &eRes)
	return *res.(*restapi.ExportedJarRes), err
}
But as soon as I step into createJar, jarReq is nil in the debugger.
In attempts to debug this I have printed out jarReq in createJar(), like so:
func createJar(jarReq restapi.JarReq) (jarRes restapi.ExportedJarRes, err error) {
	msg := fmt.Sprintf("%v", jarReq)
	fmt.Println(msg)
	jar := jarReq.Jar
	repo, err := domain.NewJarRepo(env.App.Database)
	eRes := restapi.ExportedJarRes{}
	res, err := handlers.CreateModel(repo, &jar, &eRes)
	return *res.(*restapi.ExportedJarRes), err
}
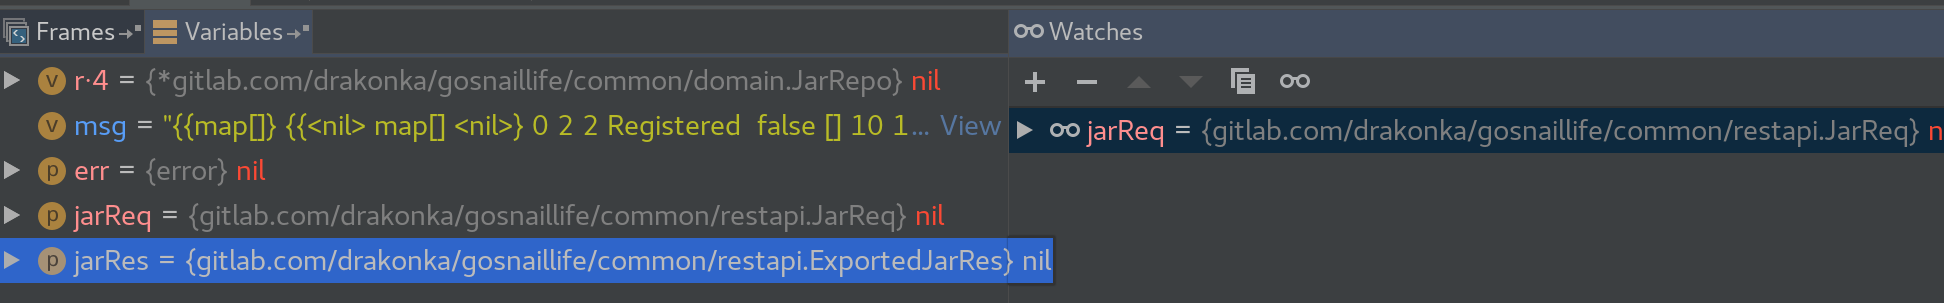
I can see that when I set msg, the value looks correct. But in the debugger jarReq is still nil. Then when I take one step forward, a new variable appears in the debugger: r·4 - which is also nil, and which is of type JarRepo (which as you can see I’m retrieving in the next line, only this appears at a breakpoint on the jar := jarReq.Jar line before I ever get to domain.NewJarRepo()
Then, msg turns into an empty string - before I make any other calls or get a chance to modify that value in any way (that I can see!) Here are a couple of screenshots. Note normal looking msg, as if Sprintf clearly got something from jarReq, but a nil jarReq. Also note that jarReq shows nil before I assign anything to msg.
Now note one line forward - this is breaking on the fmt.Println(msg) line. msg is now an empty string and jarReq remains nil:

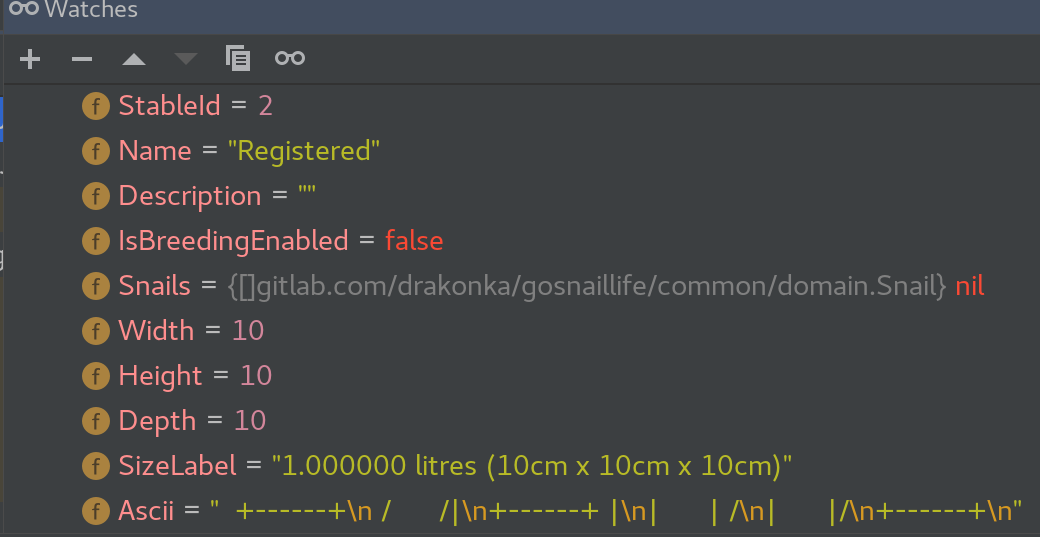
Also note that if I step through to and past jar := jarReq.Jar I do not get a nil pointer dereference panic and jar looks like it should, so it obviously got a value. Like so:
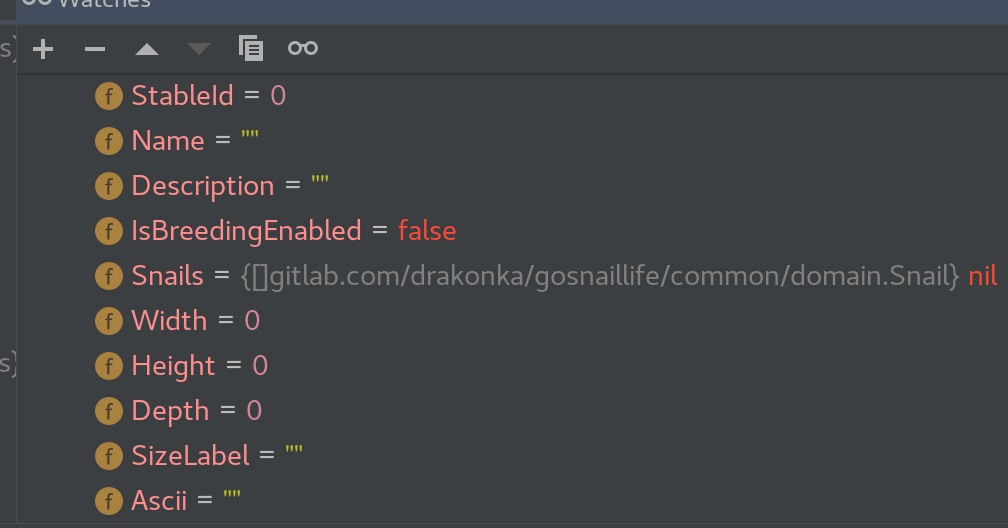
But if I take one more step forward, jar turns into a default empty struct.
Since the vars in the debugger keep turning to default structs, empty strings, and nils, I went down the chain and printed some of these things like in the examples above - the values do look correct (at least the ones I’ve checked), until the strings turn to empty strings when I step through to the next line. Has anybody encountered this? Am I missing some stupid obvious thing here?
Thanks (and sorry about the length)
 I did end up filing a bug on Delve and as suspected this did end up being an issue with compiler optimizations - I was using the wrong flags after all and only disabling optimizations for the main package. Apparently what I should be using is