Hi,
I am trying to explain why the Golang GC is slower on a platform with more resources. Our stack runs on 2 platforms.
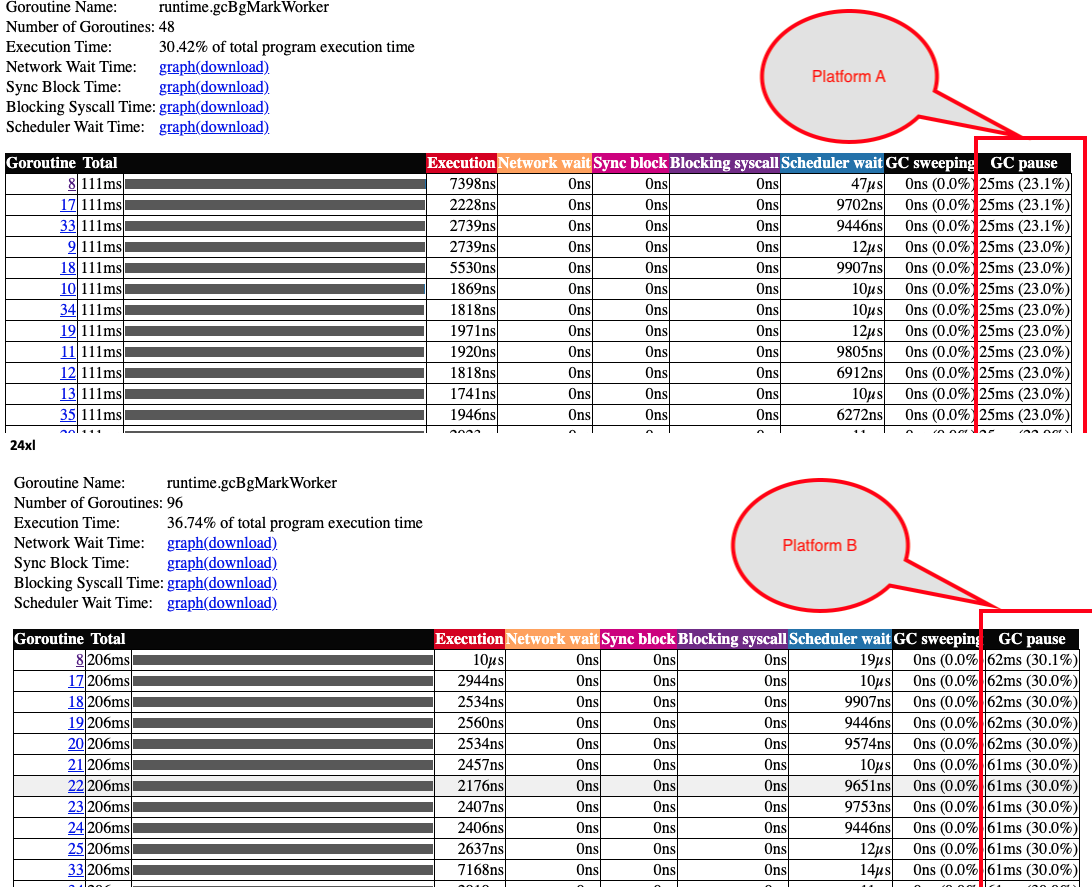
Platform A: 48 CPUs and 384 GB of memory
Platform B: 96 CPUs and 768 GB of memory.
Both the platforms have the exact same CPU type.
Essentially B has double the CPU and memory, when we were doing performance testing on our stack, Platform B had lower throughput. To prove my point I wrote a synthetic benchmark test that also shows the performance difference.
func readSkinny(data []byte) []byte {
        var dest []byte
        dest = append(dest, data...)
        return dest
}
func BenchmarkCopySkinny(b *testing.B) {
        b.ReportAllocs()
        textData :=  bytes.Repeat([]byte{0x10}, 4096)
        b.ResetTimer()
        for i := 0; i < b.N; i++ {
                readSkinny(textData)
        }
        // Benchmark ends here. Stop timer.
        b.StopTimer()
}
I am using go 1.16 and go 1.15 and I see a performance hit on both the versions.
I would appreciate any insight as to why GoLang GC seems to take longer on the more powerful platform? And possibly a work-around to make Platform B perform at least as well as Platform A.
I have tried playing around with
GOMAXPROCS but that does not seem to make any difference.
I have pasted a few screen shots from the trace profile. It looks like GC pause does take longer.
I can also see frommthe flameegraph in the cpu profile, the sweep phase takes longer on platform B.
My first guess is that the memory subsystem may be the bottleneck. If you constrain the number of goroutines on Platform B to 48, do the times get closer to platform A?
By constraining the number of go routines, you mean setting by setting GOMAXPROCS yes? The times do get a little closer. I am pasting the results below.
Are the VMs just for isolation or are multiple VMs running on the hosts? If the latter, the other VMs will affect your performance. If they’re doing anything memory intensive, that will steal resources from the VM from which you’re running the benchmark.
Just an update, I did resolve this issue. I had asked the same question on gophers.slack.com and one angel replied to this question. Asking me to check the NUMA setup in the 2 platforms.
The problem had to do with NUMA setup on Platform B. Platform B had 2 NUMA nodes. Pasting the output below, as opposed to Platform A only had one NUMA node.
The GoLang scheduler is not NUMA aware, this document describes a proposal for making the scheduler NUMA aware.
When I bound the process to one of the numa nodes using numactl --cpunodebind 0 XXX and ran the test both the platforms show the exact some performance.