In my project https://github.com/bigpigeon/toyorm
I run test with benchmark and log it’s cpu profile
go test -v -db sqlite3 -cpuprofile cpu.prof -memprofile mem.prof -mutexprofile mutex.prof -bench=Find$ -run=^$
and then I find the two function performance difference is big
=========== sqlite3 ===========
connect to :memory:
goos: darwin
goarch: amd64
pkg: github.com/bigpigeon/toyorm
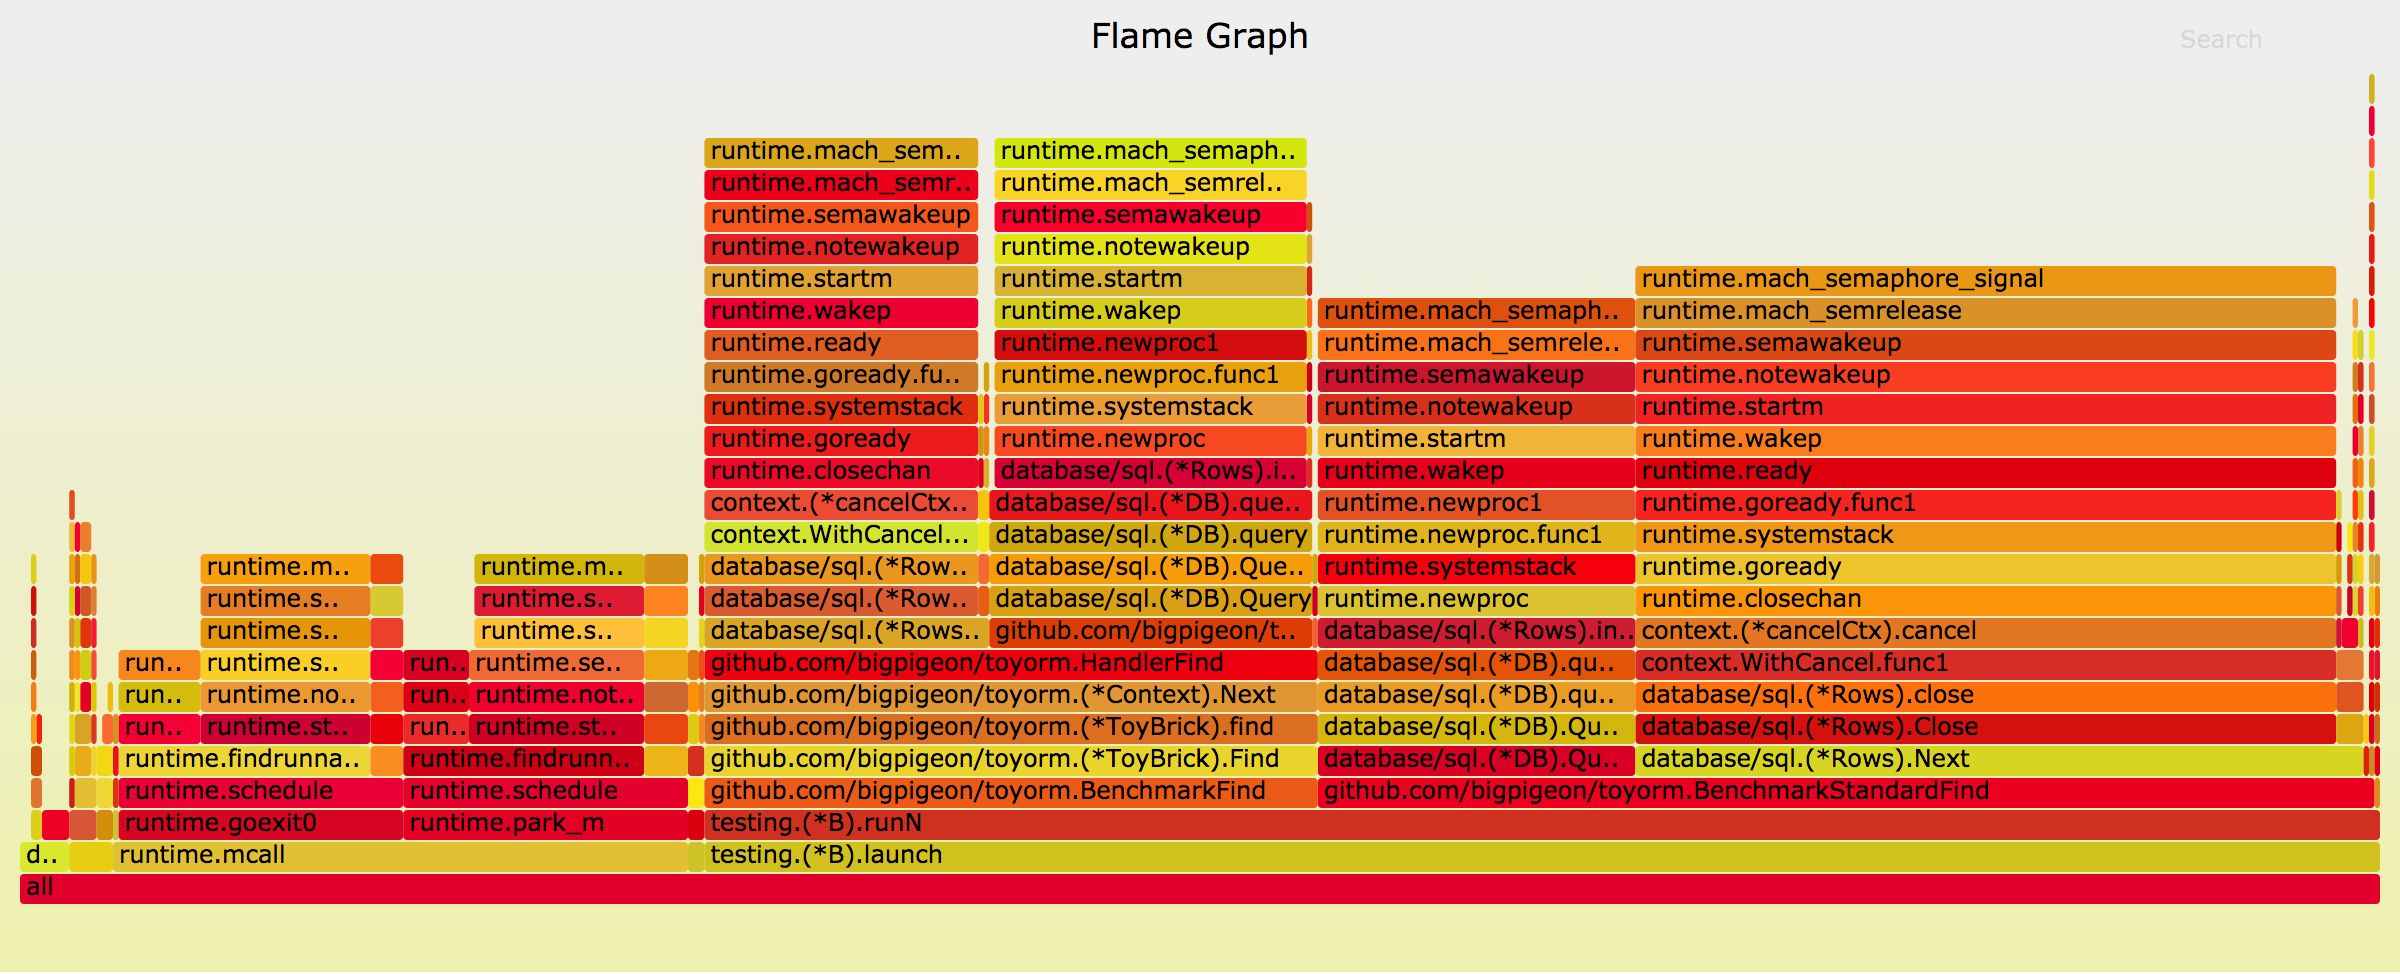
BenchmarkStandardFind-4 20000 66013 ns/op
BenchmarkFind-4 10000 116879 ns/op
but they call is similar in flame graph
1 Like
matiasb
(Matías B Insaurralde)
2
Can you point to the code?
here is benchmark code
bigpigeon
(Bigpigeon)
5
-
yes but insert and CreateTable/DropTable just run once,they use few resource so that pprof ignore they data
-
BenchmarkStandardFind & BenchmarkFind all have insert and CreateTable/DropTable operation
-
I comment b.StartTimer() get similar result
jiadeMacBook-Pro:toyorm jest -v -db sqlite3 -cpuprofile cpu.prof -memprofile mem.prof -mutexprofile mutex.prof -bench=Find$   -run=^$  .
=========== sqlite3 ===========
connect to :memory:

goos: darwin
goarch: amd64
pkg: github.com/bigpigeon/toyorm
BenchmarkStandardFind-4   	   20000	     63300 ns/op
BenchmarkFind-4           	   10000	    119001 ns/op
PASS
ok  	github.com/bigpigeon/toyorm	3.410s
system
(system)
Closed
6
This topic was automatically closed 90 days after the last reply. New replies are no longer allowed.